The D.A.T.A. Project
For The D.A.T.A. Project we first thought of a topic that would lead us to know more about our peers. Then we each came up with 5 or more questions that would give us information for our data. Thirdly we made a survey which each person in our team had to take. Once we got our data we started making graphs that would represent our data. We used quantitative, and qualitative data. We also used bivariate data, which is comparing two types of information. After we finished making our graphs we made an info graphic. A creative but easy way to understand what we are showing. The project was sort of challenging at first with the data we had to sort out and the process of making charts on Excel but other then that it was very interesting and fun to learn what our peers were like.
The theme I picked for my info graphic is birthday's. I wanted to know when people's birthday's were and how many people had the same birthday as them, etc. I thought that birthday's would make a great topic/theme for an info graphic because birthday's are special days we celebrate in life and it's the day you were born on.
Info Graphic
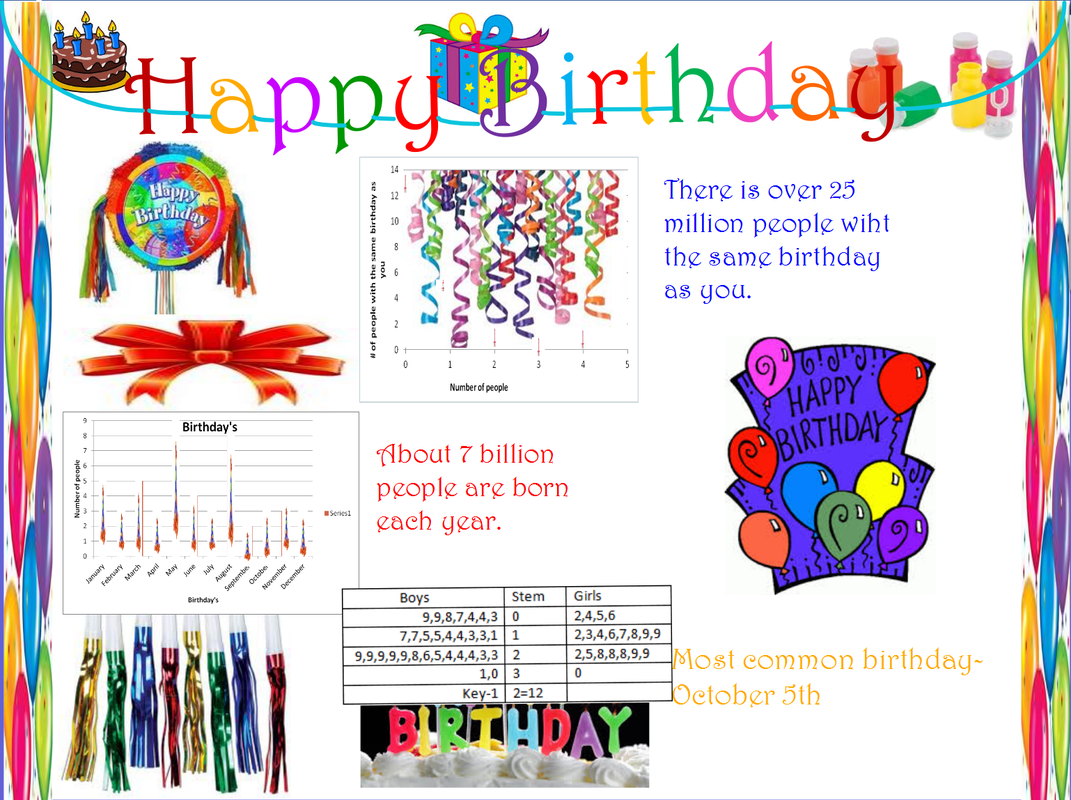
I have discovered that the most common birthday is in May and that there may be more boys then girls. Also that not many people have the same birthday as them. It was fun getting to know all this information about my peers because sometimes you don't really get to ask people questions face to face then you would on paper.
